A Home Inspection Report Should Give You Context, Not Just a Count

61 Findings, and Only 3 That Need Action Now: How Our Reports Give You Context
When you open a home inspection report, jump to the summary, and read the words "61 Deficiencies." It can feel overwhelming. Sixty-one problems. Is this house falling apart? Should I run?
Take a breath. That number by itself tells you almost nothing. A report that just hands you a pile of problems has done part of it's job. The part that actually helps you decide your next move is context: how serious is each item, what system it belongs to, and what you're supposed to do about it. That is what a Tech Inspect report is built to give you, and it is the difference between a document that creates panic and one that creates a plan.
A Tech Inspect home inspection report communicates context by rating each finding on a severity scale (Monitor, Maintenance, Minor, Moderate, or Major), grouping it by the system it belongs to (roof, electrical, HVAC, and so on), and documenting it with a written narrative, photos, and video. A Tech Inspect report also applies tags such as Safety Hazard, Installation Defect, Aged, or DIY, so you can see at a glance not just how many issues exist, but which ones need your attention first and who should handle them.
Why does a raw count of problems mislead buyers?
Here is the actual severity breakdown from that same report with 61 findings.

Of the 61 items, only 3 are Major, the ones that call for immediate action. Another 36 are Moderate, 17 are Minor, and just 5 are low-level Monitor or Maintenance notes. That means that 36% of the things, highlighted in the report, are not serious problems. So the real summary is not "61 problems." It is "3 things to take seriously right now, a set of moderate items to plan and budget for, and a handful of small stuff, to take care of over time." Same house, same report, completely different feeling once you can see the context.
And "61 deficiencies" is not even the whole report. Our reports separate three different kinds of entries: Information (general observations about the home), Limitations (anything we could not fully inspect, and why), and Deficiencies (actual issues). That 61 only counts the deficiencies. All the routine documentation of things that are working fine sits in its own category. A long report is not the same thing as a home that has major problems.
How do the severity levels give each finding context?
Every deficiency gets a severity level, and the levels are a sliding scale from "keep an eye on it" to "deal with this now." Here is what each one means in our reports:
Information: Something we wanted to bring to your attention, it's not defective, but just something to be aware of for the future, or to help explain why something is the way it is.
Monitor: the item should be watched for a change in condition. Nothing to fix today, but worth checking over time.
Maintenance: routine upkeep, the normal care every home needs to prevent bigger problems later.
Minor: a defect with low impact.
Moderate: a defect that requires attention.
Major: a defect requiring immediate action.
Something we do different is to use Informational entries, which document something about the construction or condition of the home without it being a defect at all, but is still something we want to make you aware of or bring to your attention.
The point of the scale is priority. If we labeled everything simply as a "problem," you would have no way to tell the $9 fix from the $9,000 one. The severity level is the first filter that tells you where to spend your attention, your time, and your budget.
What do the tags add?
Severity tells you how urgent something is. Tags tell you what kind of issue it is and who should handle it. A finding can carry one or more, and they add a second layer of context on top of the severity level. A few of the most useful ones:
Safety Hazard: a safety issue that needs prompt attention.
Installation Defect: the item was not installed properly, and correcting it addresses a functional, performance, or durability concern.
Aged: the component is near, at, or past its typical service life. It may still work, but plan for repair or replacement.
DIY: this one can normally be handled by a homeowner.
Additional Evaluation: we recommend a qualified professional take a closer look.
Invasive Evaluation: conditions suggest concealed damage may be present, and getting behind the surface is recommended to find the full extent.
Inquire with Seller(s): an item where you need more history or information from the seller.
Upgrade / Safety Upgrade: something that was acceptable when the home was built, but standards have since changed. An opportunity to bring the home up to modern practice.
Put severity and tags together and a single line item tells a story on its own. "Moderate, Installation Defect, Additional Evaluation" reads very differently from "Minor, DIY," and you know how to treat each one without having to guess. Every label is defined right inside the report, so you are never left wondering what a term means.
How does grouping by system help you see the big picture?
The report also groups every finding by the system it belongs to. Here is that same 61-item report broken out by section.

This view answers a different question: where does this house actually stand? In this example, 19 of the 61 items are on the Exterior, while the Basement, Foundation, Crawlspace and Structure section has exactly 1, and Electrical and Plumbing have 1 each. That is a meaningful story. A home with most of its findings clustered in exterior maintenance items is in a very different position than one stacking up defects in its foundation and major systems. Grouping by system lets you and your agent see the pattern instantly, instead of reading 61 entries and trying to figure it out.
If the majority of items are identified on the exterior, that means you have one large exterior project, that could solve the majority of the findings, not 61 individual projects.
What makes the narratives thorough instead of a single line?
This is where a lot of reports fall short. You have probably seen the type: "Roof is old. Replace." One sentence, no explanation, no help.
Every Tech Inspect finding is written in a consistent, three-part narrative so you understand it fully:
Finding: what we observed.
Implication: why it matters.
Recommendation: your options for resolving it, whether that is a simple DIY fix, routine maintenance, or a call to a specific type of professional.
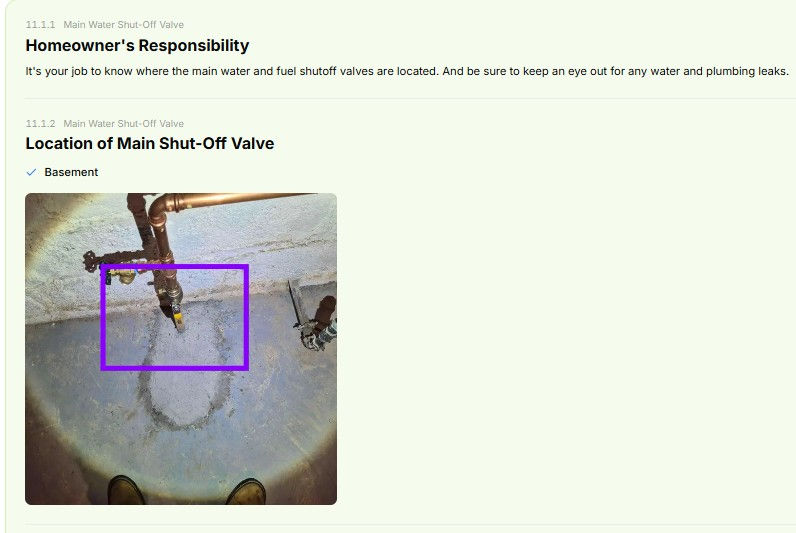
On top of the written narrative, each finding is documented with high-resolution photos, and video where it adds clarity. For items you can handle yourself, we often include a short clip or a link to the right part. You are not taking our word for it or trying to picture what we saw. You can see it, in place, exactly as we found it.

That depth is the whole point. A finding without context is just an item on a list. A finding with a clear narrative, a photo, a severity level, and a tag is something you can actually act on.
So is a home with 61 findings a bad home?
Not necessarily, and that is exactly why context matters so much. There is no such thing as a perfect house, and every inspection turns up something. A long list can look alarming until you sort it the way our reports do: a few items that need action now, a set of moderate items to plan and budget for, and some minor and maintenance notes for down the road.
Our job as your inspector is not to pass or fail a house. It is to document its condition honestly and hand you a clear, organized picture, so you, your agent, and your budget can make the call that is right for you. The number is never the story. The context is.
See exactly how a real report reads
The fastest way to understand this is to open one. We have published three full sample reports you can click through just like a client would, with the severity levels, tags, photos, video, and plain-English narratives all in place. It takes about two minutes, and it is the clearest picture of what you will walk away with. You can also see everything that goes into a Tech Inspect report.
Frequently asked questions
What do the severity levels on a home inspection report mean? In a Tech Inspect report, each deficiency is rated Monitor, Maintenance, Minor, Moderate, or Major. Monitor and Maintenance are low-level items to watch or keep up with, Minor and Moderate are defects of increasing impact, and Major means the item needs immediate action. The scale exists to help you prioritize.
Does a high number of findings mean the house is in bad shape? Not by itself. The count only tells you how many items were flagged, not how serious they are. A report that sorts findings by severity and by system shows you the real picture, which is often a small number of significant items inside a much longer list of minor and routine ones.
What is the difference between a severity level and a tag? Severity tells you how urgent a finding is. A tag tells you what kind of issue it is and who should handle it, using labels like Safety Hazard, Installation Defect, Aged, or DIY. Together they let a single line item communicate both priority and next steps at a glance.
Are photos and video included in the report? Yes. Every finding is documented with high-resolution photos, and video where it adds clarity. Each finding also carries a written narrative describing what we observed, why it matters, and what your options are.
What counties does Tech Inspect serve? St. Charles, Franklin, Warren, and Lincoln counties, plus the greater St. Louis area.
Ready for a report that actually explains what it finds?
A thorough inspection, severity levels and tags that give every finding context, photos and video throughout, and a report delivered within 24 hours. See three full sample reports, explore everything inside the report, or schedule your inspection.
Tech Inspect Home Services LLC · 3580 Highway T, Marthasville, MO 63357 · 636-201-6366 · sean@techinspecthome.com